Ansible
If you have been around for the full transition of Cisco ASA and Firepower into Firepower Threat Defense (FTD) or now ...
If you have been around for the full transition of Cisco ASA and Firepower into Firepower Threat Defense (FTD) or now Cisco Secure Firewall (CSF). You may have seen this before or at least be familiar with how Cisco ASA or LINA still exists and is now managed almost completely through the Firewall Management Center (FMC). While the transition and combination of the two software solutions is nearly complete there are still some instances where things are just not fully "there". In this article, we will cover how Network Module interfaces are one of those items that just didn't fully make it, yet.
The Hardware
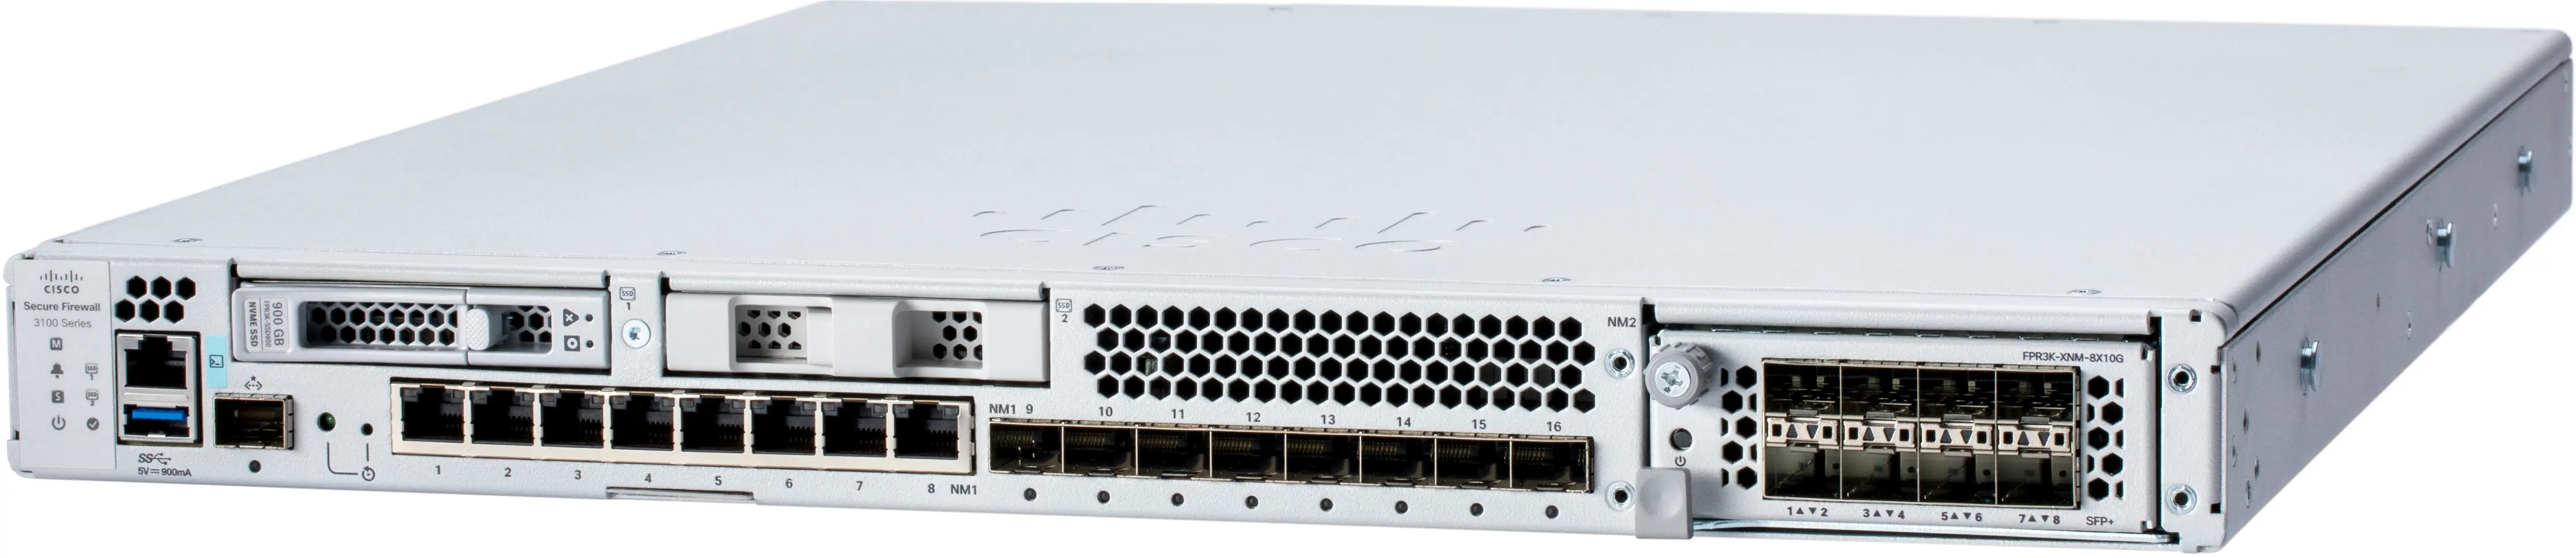
As you can see in the hardware image above, the 3140 had 16 onboard interfaces, 8 copper and 8 SFP, and an optional netmod slot on the far right that supports a few options for either more ports or even 40G as this example will show. Being a long-time Cisco engineer I am accustomed to being able to run a "show interfaces" command and see all the interfaces on the hardware system and more importantly their status. For this example we will use a 3140 with the 4x40G network module (netmod). During a recent implementation, I found myself having some connectivity issues with the 40G interfaces in the netmod and the typical show interfaces was only showing the 16 onboard interfaces and the management interface. So how did I figure out the issue or continue troubleshooting this if I couldn't see the interfaces? The answer comes in the form of the additional CLIs in FTD which are the platform management interface called Firepower eXtensible Operating System (FXOS) which mates the FTD and LINA software to work together with the host hardware. The other is the "system support diagnostic-cli" which gives you access the ASA/LINA CLI.
Navigating FTD, LINA, and FXOS?
The first CLI interface we will start with is the interface that the other two are accessible from and is the primary CLI that you will use to interact with the FTD appliance. Many of the show and interface commands that are run here are actually the output that you would see in an ASA if FTD was not in the situation.
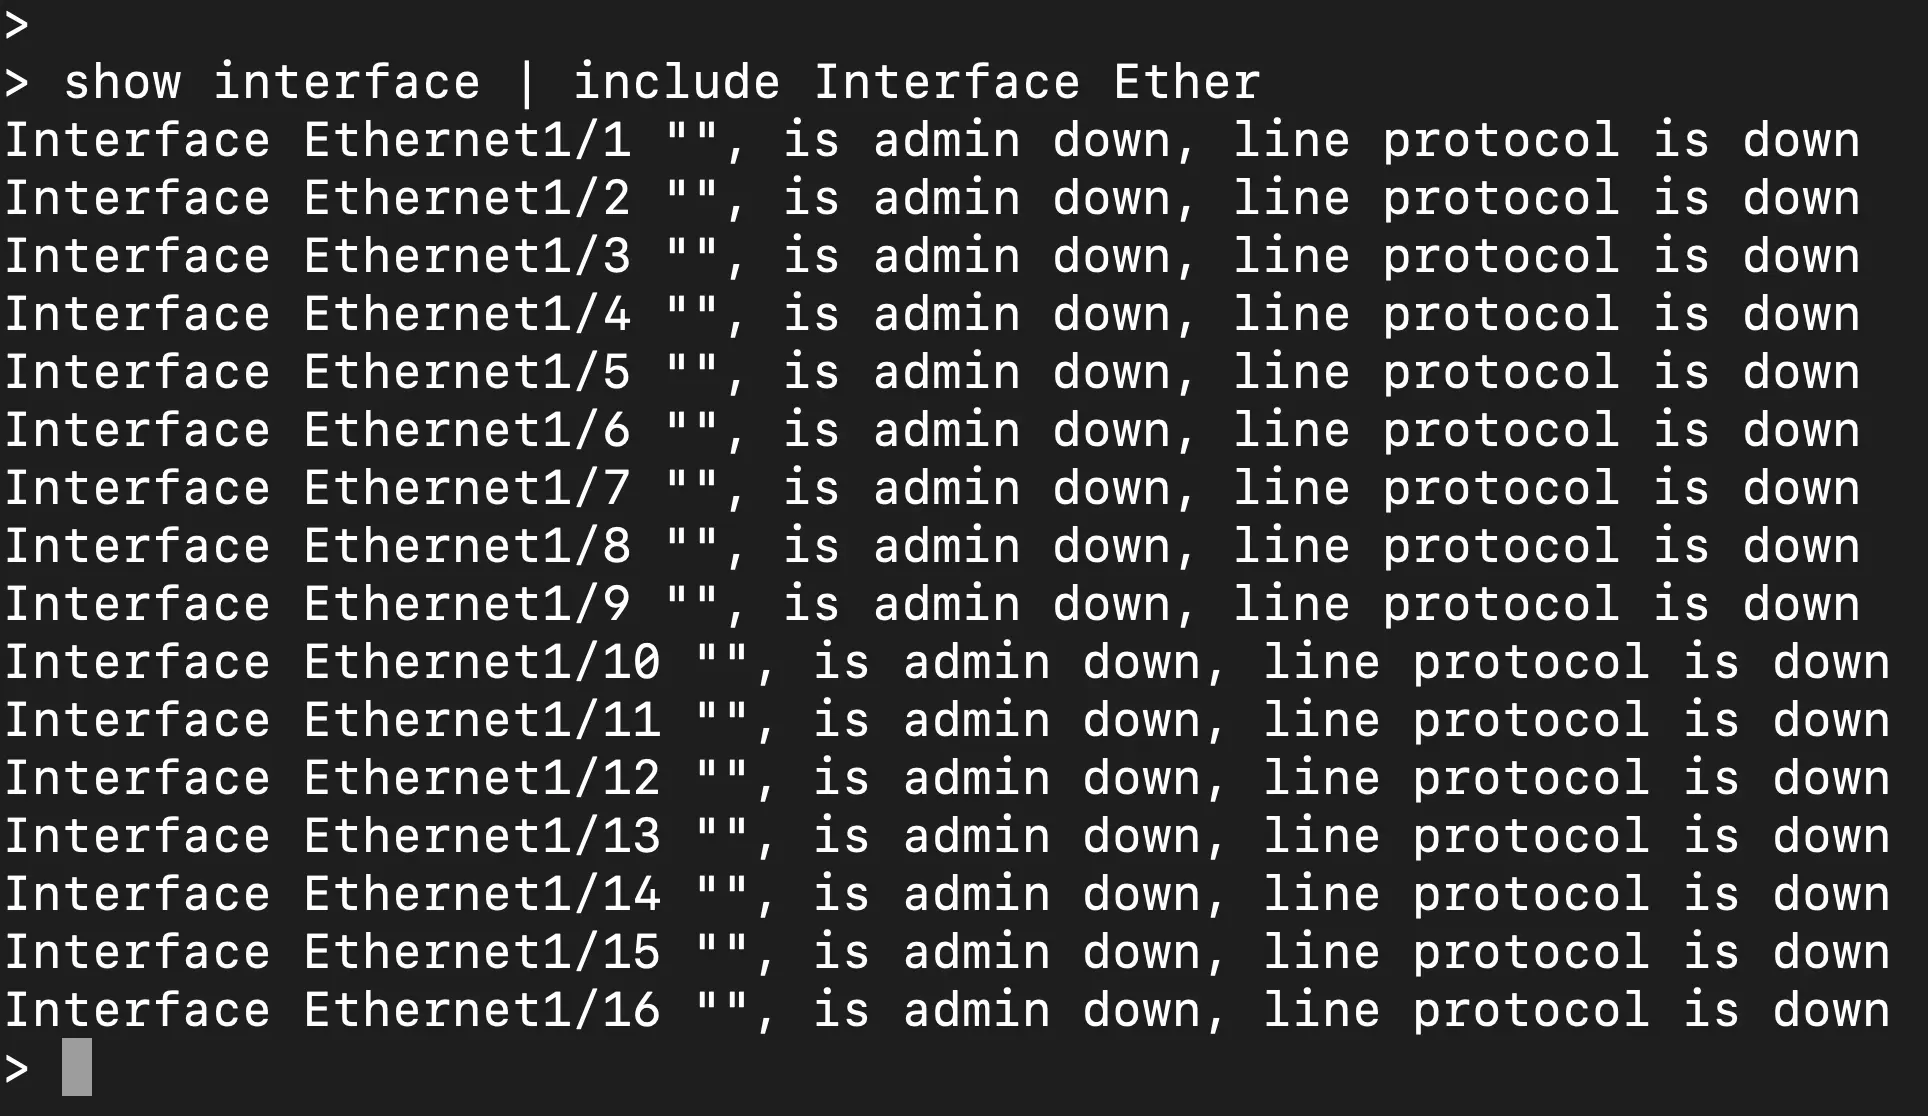
Above you can see the show interface output on the 3140 in this situation that does have the netmod installed, and as a matter of fact, is currently an active member in a cluster with the 40G interfaces in port-channels being the used for the data and cluster control links.

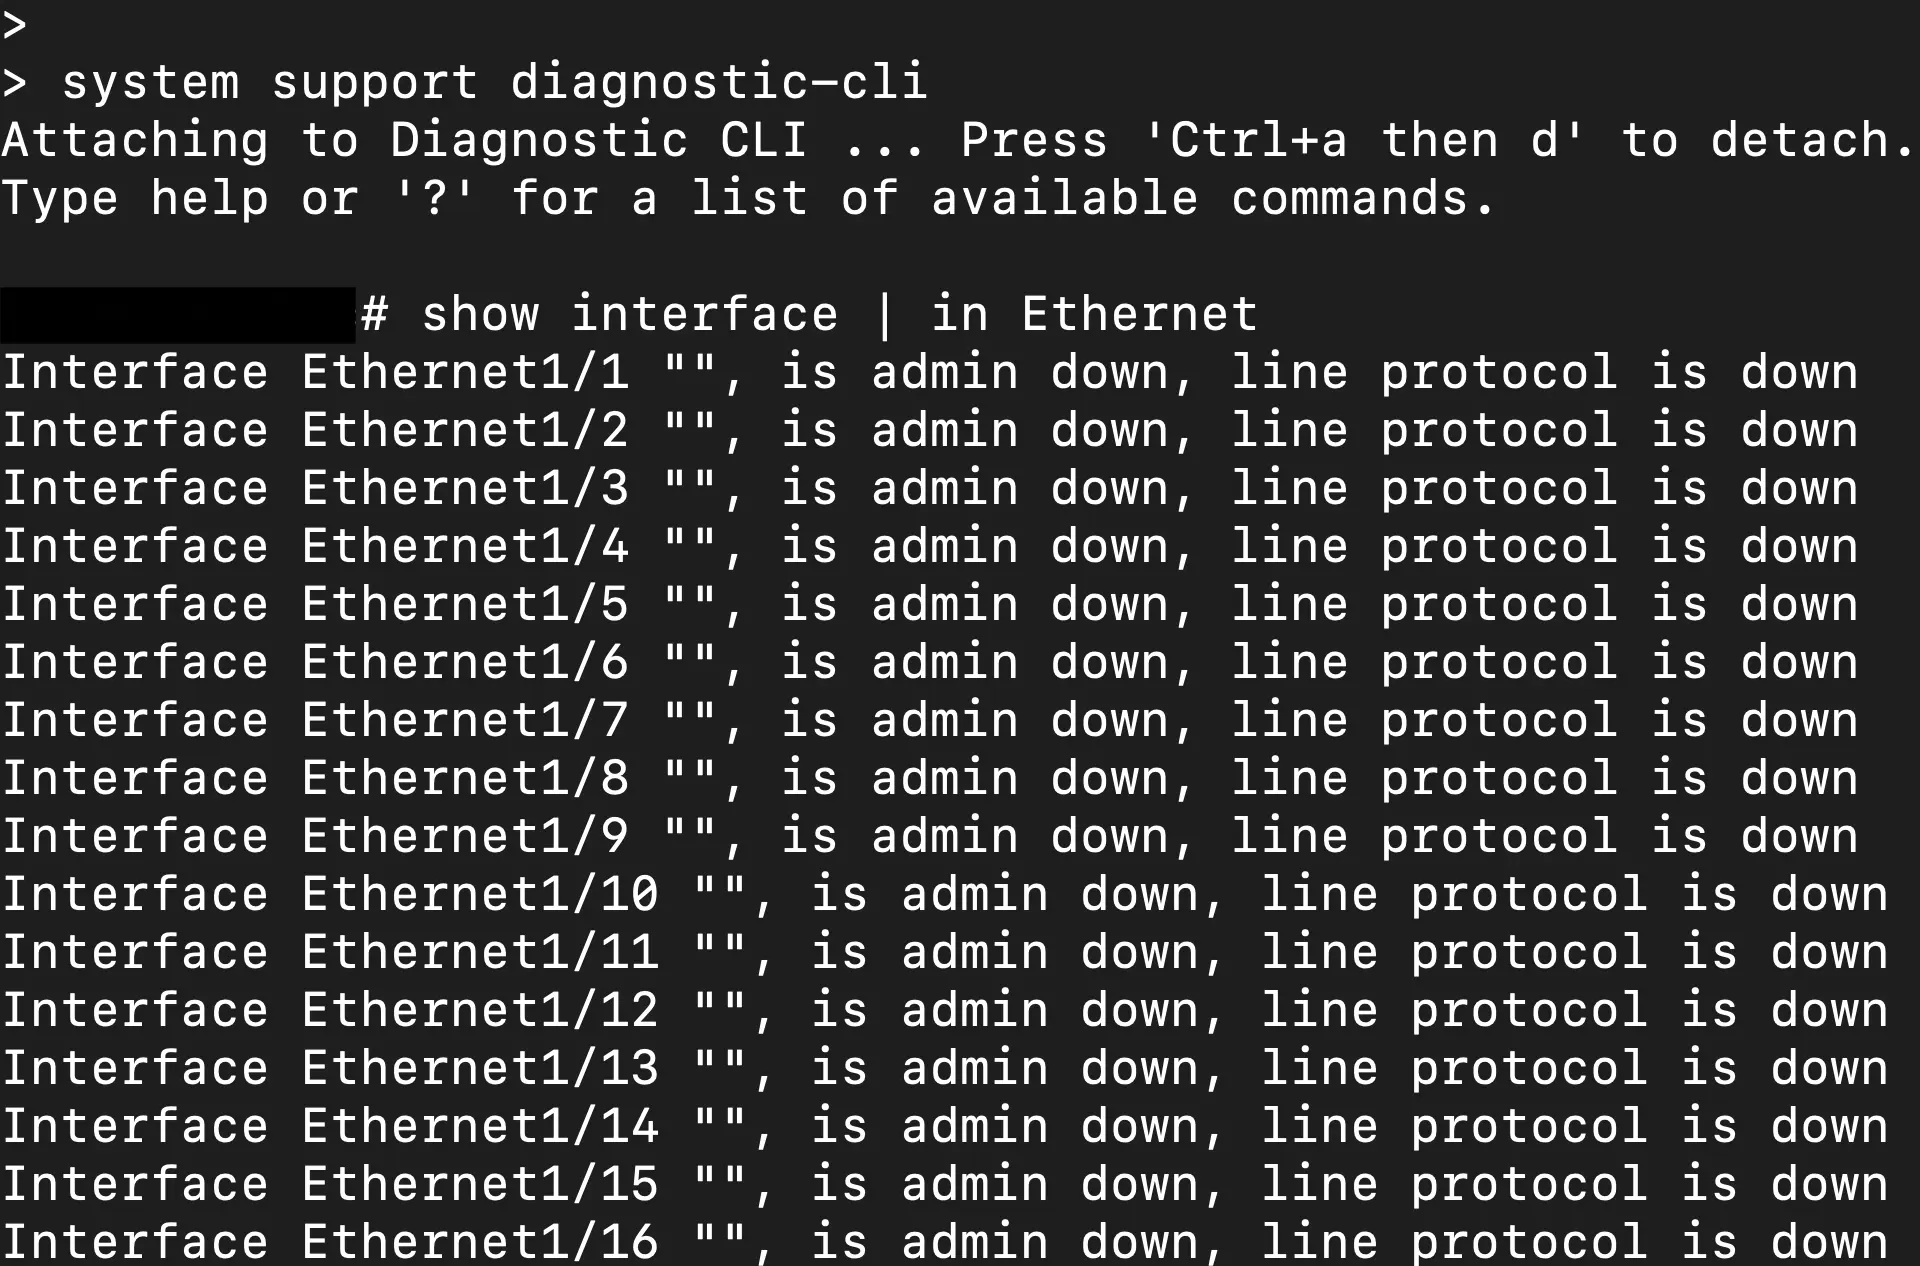
But as you can see the interfaces are not shown in the FTD CLI output while there is an active port-channel with the missing interfaces. There is a direct console connection to the ASA/LINA CLI through FTD by running the "system support diagnostic-cli" command. Maybe that would show it? Nope, the show output of the FTD CLI is a direct port of the ASA/LINA CLI as shown.
So how can we further diagnose if we cannot see the interface status?
Find the interfaces in the FXOS CLI!
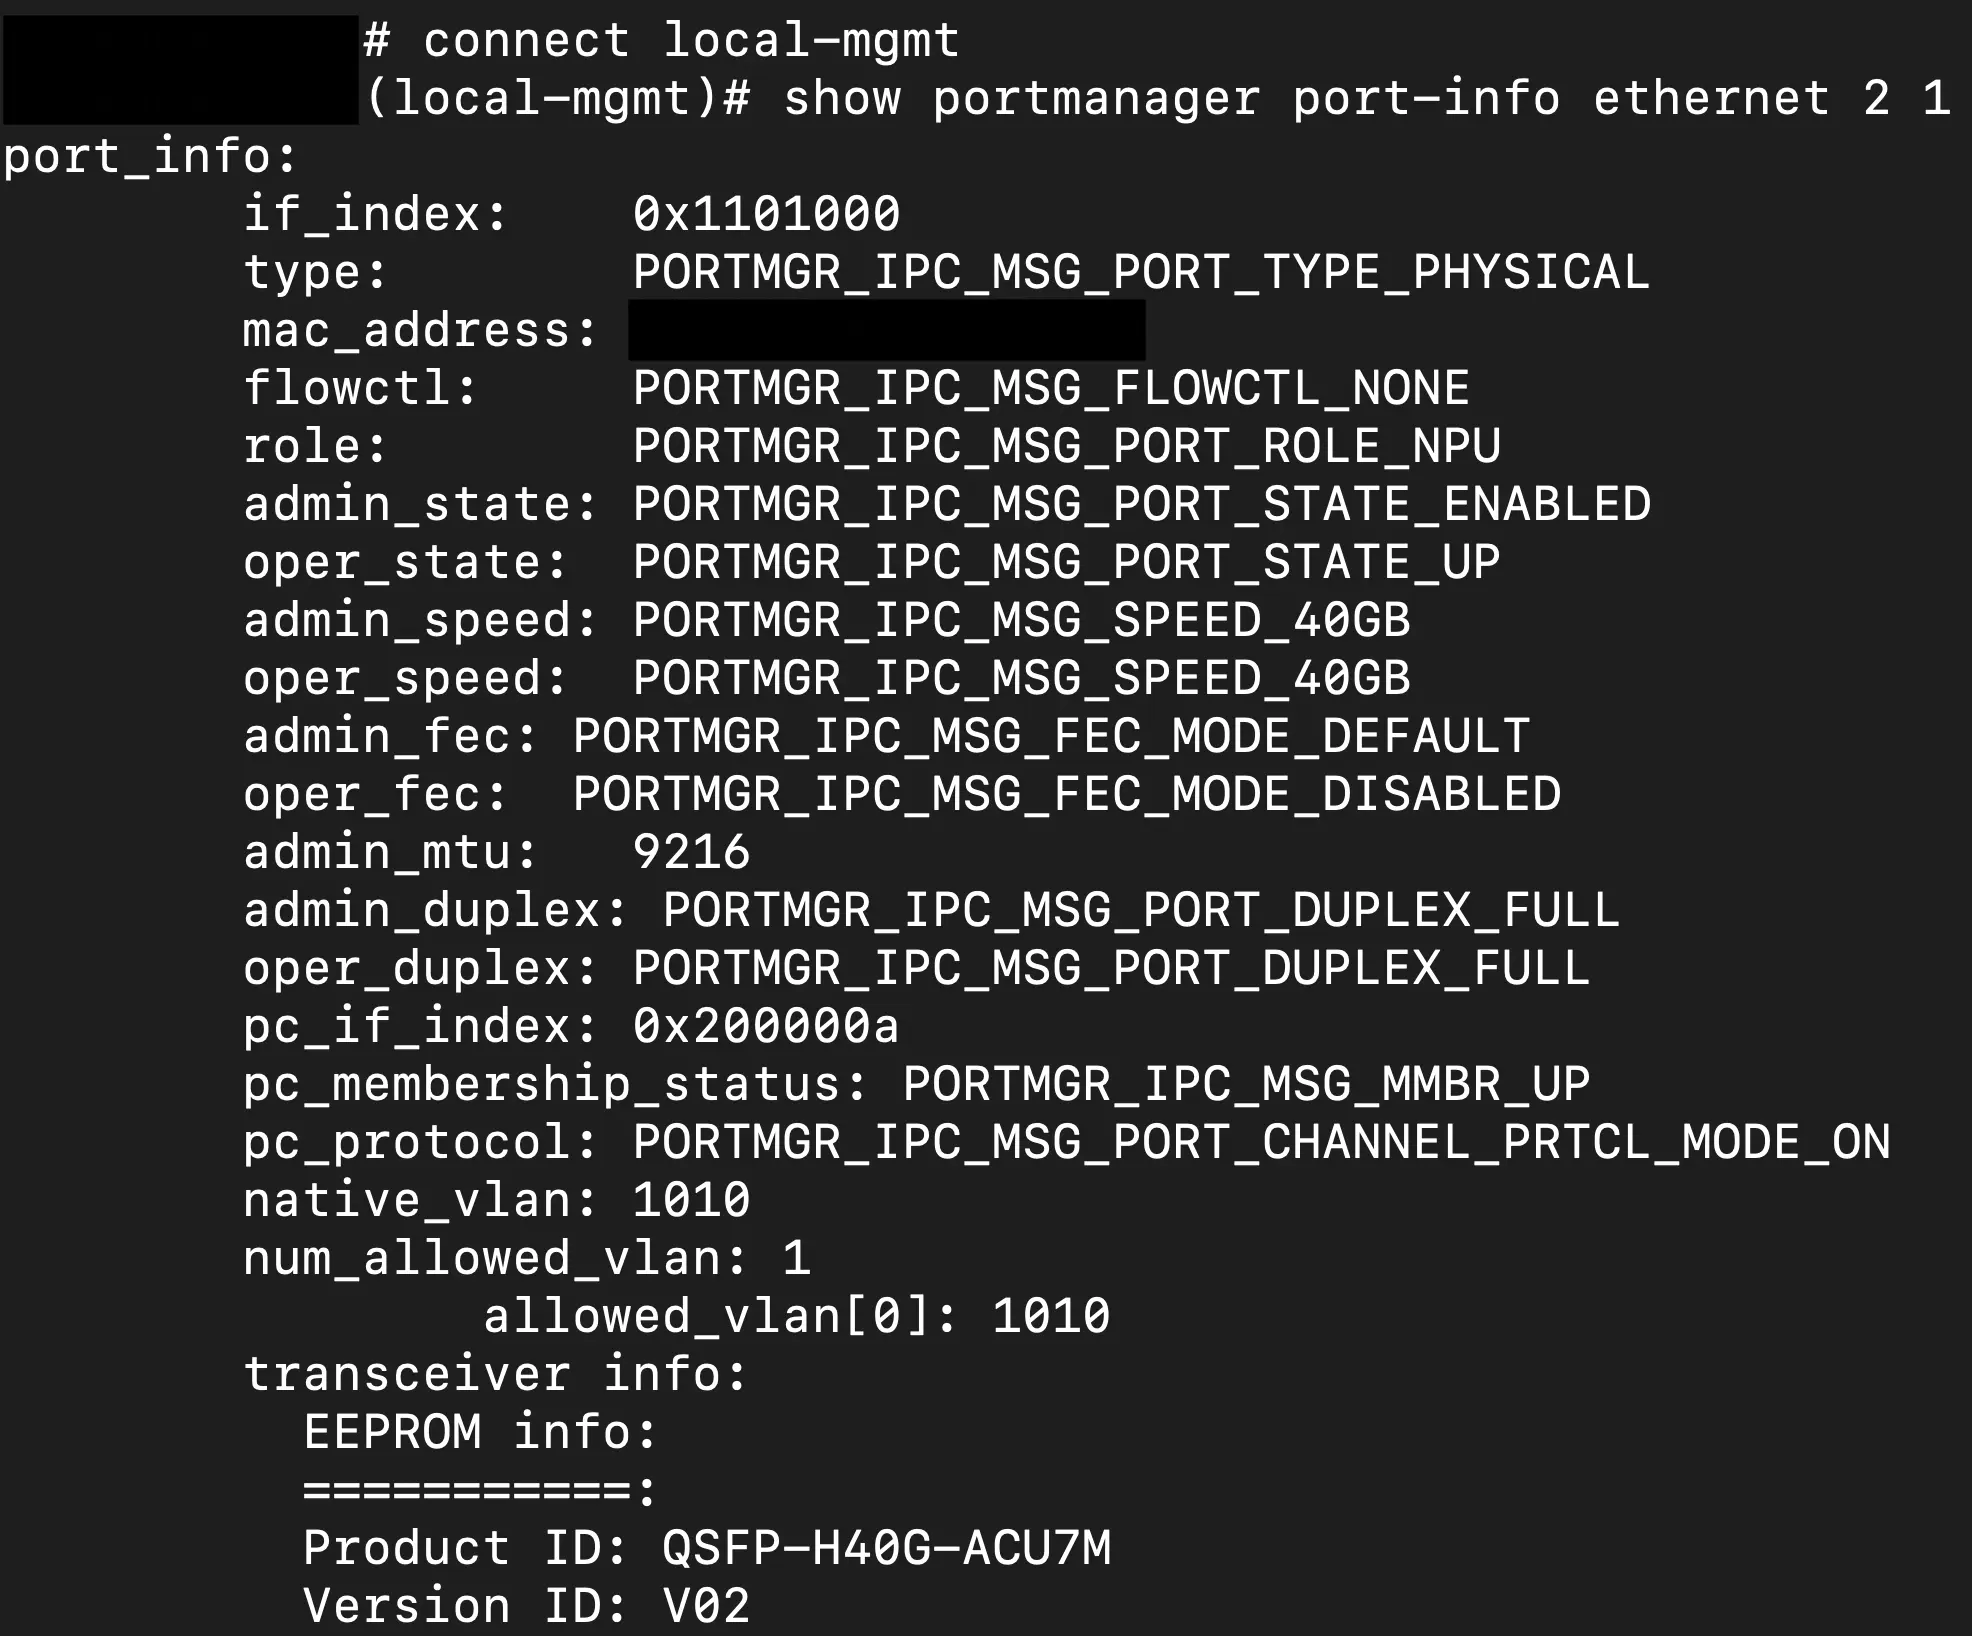
As mentioned previously FXOS is the platform software that mates the hardware with the FTD and subsequent ASA/LINA code. This is where we can finally see interface statistics and statuses for our netmod interfaces in slot 2 of the appliance. Starting at the FTD CLI we can connect to FXOS with a "connect fxos" command. After connecting to FXOS we then need to get into the local management view with a "connect local-mgmt" command. From this view, we will want to look at the interface status with a "show portmanager port-info ethernet 2 1". On the 3140 the netmod slot is numbered 2 and in a 40G use case, the interface numbers are simply 1-4.
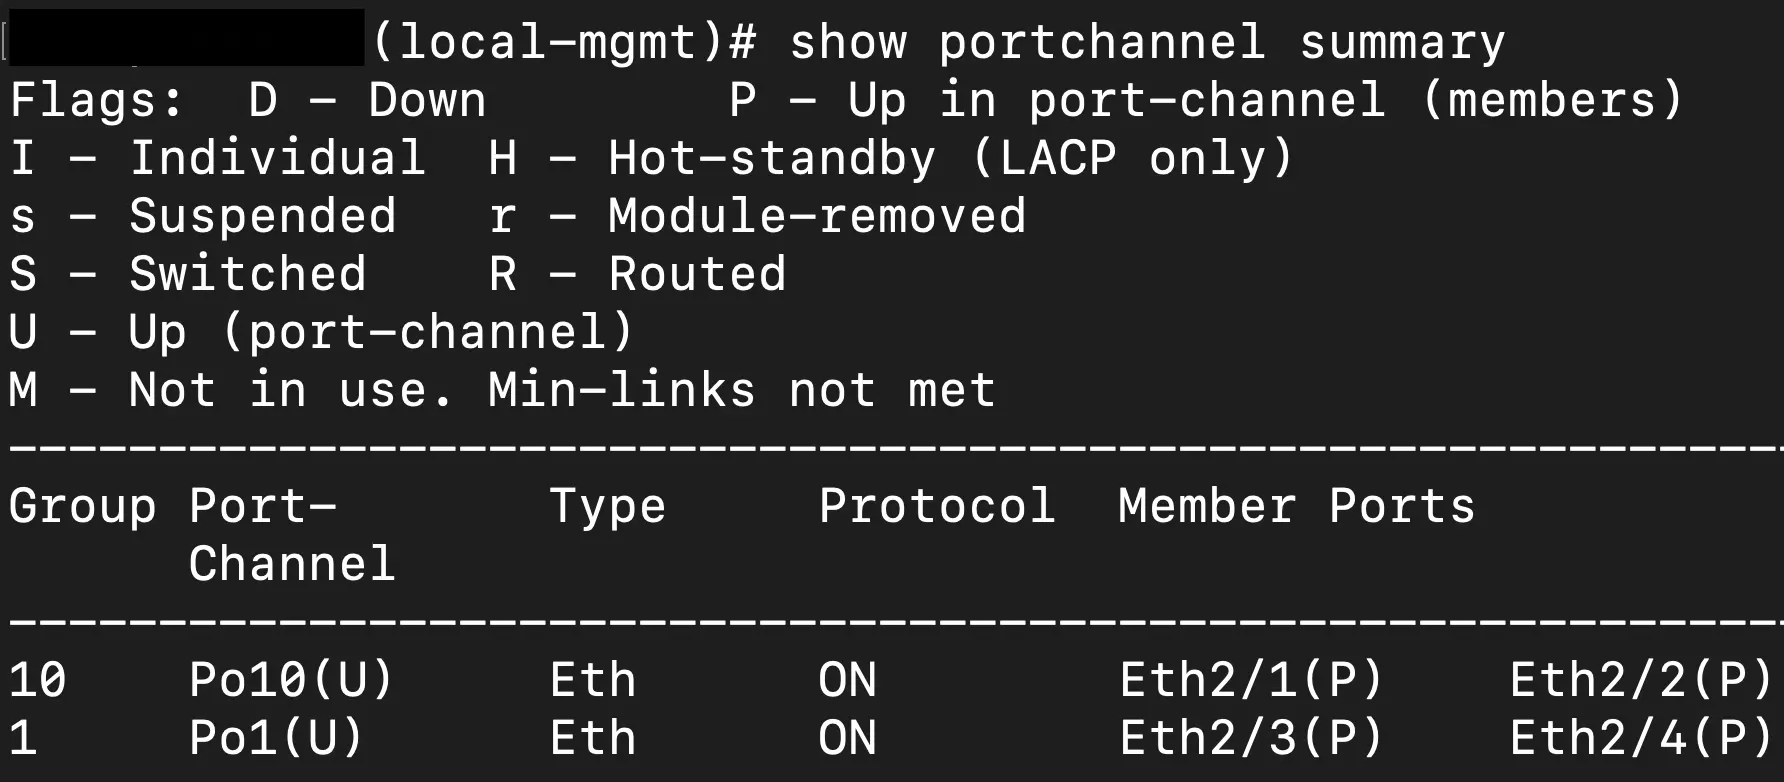
Additionally, from the local-mgmt contex if you are using port-channels like I am in this situation you can additionally use a show command to see the status of the port-channel and the interfaces that are a part of that aggregation.
Lastly, we can go even deeper into the FXOS CLI by exiting the local management scope and digging into the "scope" commands to hone in on the context of an individual interface or port channel. The scope we ultimately need to get into for this scenario is the fabric interconnect of the ethernet uplinks of the chassis, aka our 40G interfaces. The following image shows the sequence to get into the fabric interconnect and see the port status in the example portchannel.
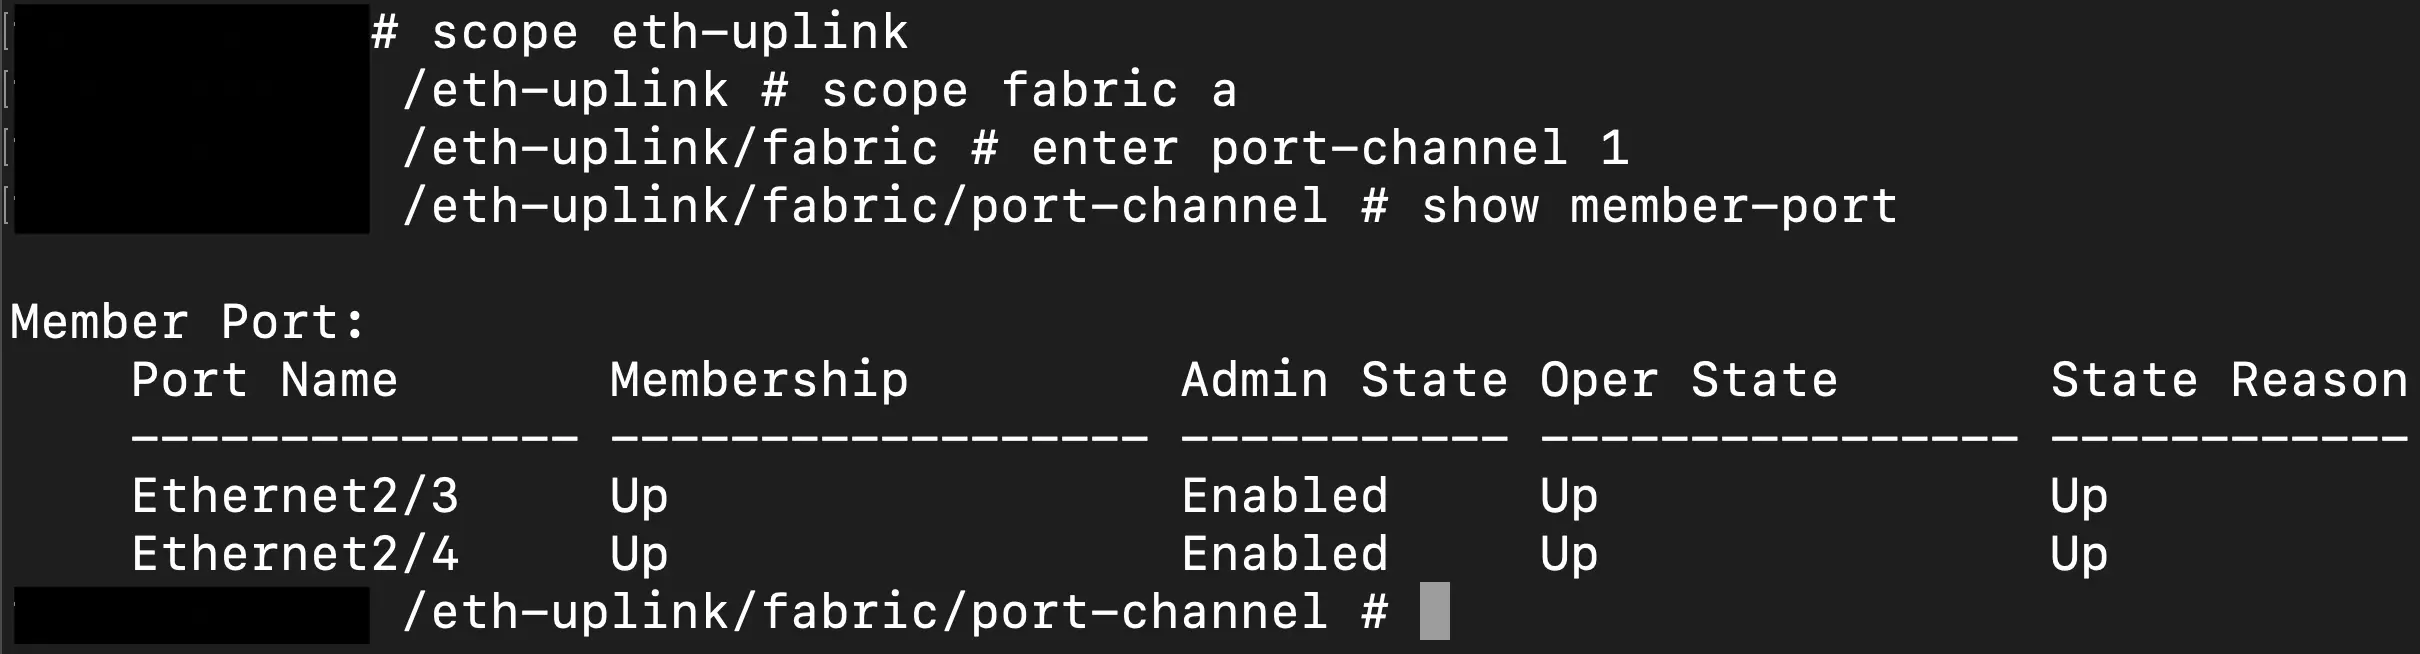
This show command gives us a good view of the status of the interfaces, UP/DOWN, and if they are a part of the port channel and enabled via the device management on the FMC.
Conclusion
Sometimes that command output you expect to see just isn't there and, in the case of Cisco Secure Firewall appliances, that may just be the nature of the beast in how the software is integrated with the platform that it is running on. Hopefully, this helps you figure out how to navigate the FXOS CLI a little to find out interface statuses that you don't see in the standard CLI context. I will encourage you to navigate around in FXOS, on a test system of course, to get familiar with the scopes and what resides in each as well as what you can truly see from here that may not reflect instantly in the FMC UI. Troubleshooting can always be frustrating and fun but familiarity with the operating systems and platforms makes it that much easier to identify the problem in a systematic and pragmatic fashion.
ModernCyber’s Services
If you are looking for help with Cisco Secure Firewall or other consultative or implementation services, we provide multiple service options that can be customized to the outcomes and requirements you need to meet.
Schedule some time to speak with one of our cybersecurity experts.