
If you run ISE, you might have seen this alarm before.
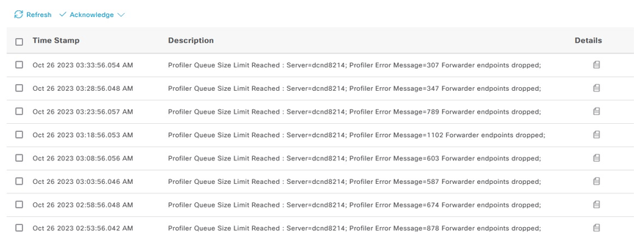
Essentially, this alarm means a PSN threw endpoint updates in the trash. This is a problem because accurate profiling depends on the attributes of the device. Without up-to-date attributes, endpoints may now be sitting on the wrong profile until something forces them to reauthenticate.
In this blog post, we'll explain what's going on in ISE and how to troubleshoot the issue.
The queue
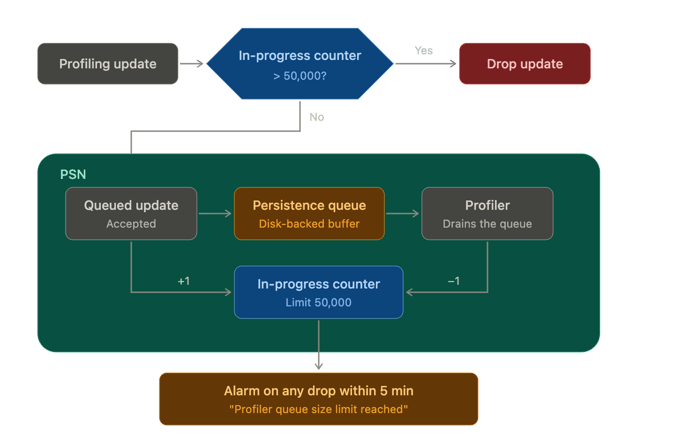
Every PSN has a profiler forwarder queue. When endpoint updates arrive — from RADIUS, DHCP, or whatever probes are feeding in — they don't go straight into the profiler. They land in this queue first, and the profiler picks them up from there to process. It's a buffer between "data arriving" and "profiler working through it," and it exists precisely so a burst of updates doesn't have to be handled all at once.
The queue has a hard ceiling: 50,000. As long as the profiler keeps up, the queue should not fill and everything flows. The trouble starts when updates arrive faster than the profiler can clear them — either because something is flooding the PSN with updates, or because the profiler is bogged down and can't drain the queue fast enough. Either way, the queue starts filling.
And when it hits the 50,000 ceiling, ISE doesn't slow down or push back on whatever is sending the updates. It drops them. The overflow updates are discarded, and they're gone. Those lost attributes are the ones ISE would have used to (re)classify the endpoint. Without them the device holds its old profile — and the access that goes with it — even if it's now wrong, until a new authentication gives ISE the data to correct it.
How to troubleshoot it
The alarm is a symptom. The queue filling up means something upstream is generating more profiling traffic than the deployment should be seeing. The question is what's feeding it, and the fix is almost always upstream of ISE.
- Start on the alarming PSN. The alarm names the server.
- Find the top talkers. ISE's dashboard top-talker views point you at the MAC addresses generating the most profiling events on that PSN. A small number of endpoints usually account for most of the volume.
- Trace each top talker back to a cause and fix it upstream. This is where the table below comes in.
Conclusion
Newer versions of ISE (3.5+) ship with a profiler resiliency feature that cushions these spikes before they reach hard drops. It runs three monitors. One watches the endpoint update rate and mutes individual "chatty" endpoints. One watches the queue's fill level. One watches the PSN's overall resource load. When any of them crosses a threshold, ISE sheds lower-value work for a short cool-off period — it suppresses interim updates and reclassification, and in the worst case processes only new endpoints. It's a useful safety net. But it's not a reason to skip finding out what set the queue off in the first place.
Please reach out with your questions and comments.
See it for yourself. Request a ModernISE Platform test drive at moderncyber.com/testdrive — or reach us at info@moderncyber.com.
Integrated · Agile · Zero Trust · AI